Reno County, Kansas: hail history 2014–2026
By density Reno County lands #51 of 101 in Kansas: 111.6 reports per 1,000 square miles from 142 reports. Of 44 days at 1 inch or more, 21 topped 1.75. Record: 2.75 inches (a baseball), July 13, 2015 near Willowbrook.
- 142reports
- 44days, 1 in+
- 21days, 1.75 in+
- 2.75 inlargest stone
Hail since my roof went on: Reno County
Year by year
| Year | Reports | Days 1 in+ | Days 1.75 in+ | Largest |
|---|---|---|---|---|
| 2014 | 20 | 7 | 2 | 1.75 in |
| 2015 | 26 | 6 | 3 | 2.75 in |
| 2016 | 11 | 4 | 2 | 2.5 in |
| 2017 | 5 | 2 | 1 | 2 in |
| 2018 | 22 | 4 | 2 | 2.5 in |
| 2019 | 22 | 7 | 5 | 2.75 in |
| 2020 | 2 | 1 | 0 | 1 in |
| 2021 | 2 | 0 | 0 | 0.75 in |
| 2022 | 4 | 2 | 1 | 1.75 in |
| 2023 | 4 | 1 | 1 | 2 in |
| 2024 | 6 | 3 | 1 | 1.75 in |
| 2025 | 5 | 2 | 1 | 2.5 in |
| 2026 (Jan–Jun) | 13 | 5 | 2 | 1.75 in |
2015 was the busiest year (26 reports) and 2020 the quietest (2). Reno County averaged 4 reports a year from 2020 to 2025, 78% under the 18 of 2014 to 2019. 2026 stands at 13 through June, already past the full-year average of 11. Days with 1-inch stones average 3.2 per full year.
Reno County: reports by month
| Jan | 0 |
|---|---|
| Feb | 0 |
| Mar | 2 |
| Apr | 33 |
| May | 51 |
| Jun | 25 |
| Jul | 21 |
| Aug | 3 |
| Sep | 3 |
| Oct | 3 |
| Nov | 0 |
| Dec | 1 |
May dominates the calendar: 51 of 142 reports, 36%. April to June alone bring 77%. 6 of 142 reports fell outside April to September.
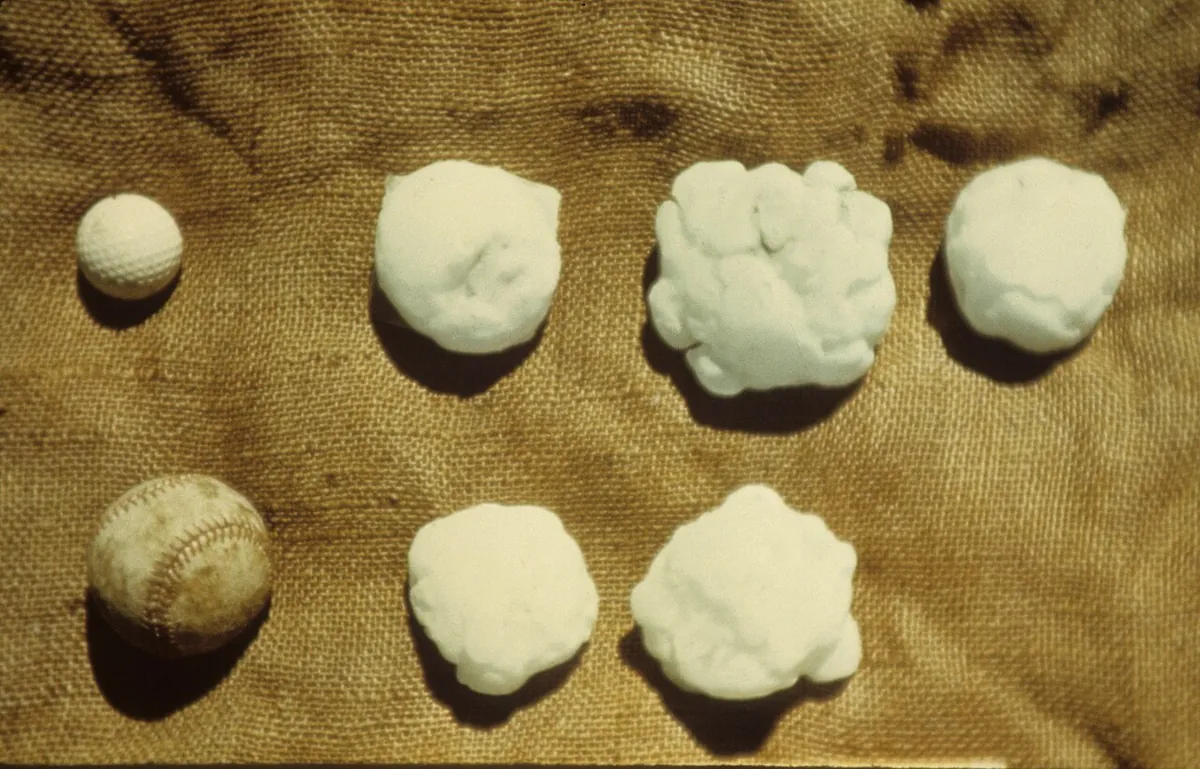
Largest stone: 2.75 inches
Reported hail locations, Reno County
- 751 to 1.74 in
- 341.75 to 2.74 in, golf ball to tennis ball
- 22.75 in and up, baseball
Largest plotted stone: 2.75 in. Bigger dots are bigger stones.
111 reports of 1 inch or larger have coordinates. Each dot is a reported location, not a storm path.
Sources: NOAA, Census county outlineReno County’s ten biggest hail days
| Date | Size | Reports | Place |
|---|---|---|---|
| July 13, 2015 | 2.75 in, a baseball | 11 | Willowbrook |
| June 22, 2019 | 2.75 in, a baseball | 3 | (Hut)Hutchinson Muni |
| May 2, 2018 | 2.5 in, a tennis ball | 8 | Nickerson |
| April 22, 2025 | 2.5 in, a tennis ball | 4 | Pretty Prairie |
| July 28, 2016 | 2.5 in, a tennis ball | 3 | Langdon |
| May 9, 2023 | 2 in, a hen egg | 3 | Turon |
| June 29, 2017 | 2 in, a hen egg | 2 | Turon |
| August 21, 2019 | 2 in, a hen egg | 1 | Haven |
| June 11, 2018 | 1.75 in, a golf ball | 10 | Nickerson |
| April 28, 2019 | 1.75 in, a golf ball | 6 | Hutchinson |
“The hail ranged from tennis ball to baseball sized. No damage had been reported yet.”
NWS report, June 22, 2019
“As the storms moved east, a combination of large hail and damaging winds moved across the area. A few tornadoes were also reported along the leading edge of the quasi linear convective system with only brief touchdowns reported.”
NWS report, May 2, 2018
Tornadoes and wind in Reno County
12 tornadoes on record in Reno County; the strongest listed is EF3, 21.5 miles long, near Turon. Top gust: 91 mph near Partridge.
| Date | Rating | Path length | Width | Near |
|---|---|---|---|---|
| May 18, 2025 | EF3 | 21.5 mi | 1760 yd | Turon |
| July 13, 2015 | EF3 | 3.7 mi | 350 yd | Nickerson |
| May 5, 2019 | EF1 | 0.4 mi | 100 yd | Nickerson |
| May 5, 2019 | EF1 | 0.14 mi | 300 yd | Nickerson |
| April 8, 2015 | EF0 | 0.82 mi | 75 yd | Cheney Res |
| May 19, 2017 | EF0 | 0.68 mi | 50 yd | Pretty Prairie |
| May 19, 2017 | EF0 | 0.64 mi | 50 yd | Cheney Res |
| October 26, 2021 | EF0 | 0.43 mi | 275 yd | Turon |
| Date | Gust | Near |
|---|---|---|
| May 19, 2025 | 91 mph | Partridge |
| June 17, 2025 | 89 mph | (Hut)Hutchinson Muni |
| May 19, 2024 | 86 mph | (Hut)Hutchinson Muni |
| May 19, 2024 | 85 mph | Haven |
| May 18, 2026 | 85 mph | Abbyville |
| August 24, 2018 | 81 mph | Hutchinson |
Homes in Reno County
Median build year in Reno County: 1963. 89.8% of 28,309 homes predate 2000. Houses permitted since 2014: 467, or 16.5 per 1,000 homes. Busiest year: 2019.
| pre-1940 | 24.4% |
|---|---|
| 1940s | 6.8% |
| 1950s | 15.2% |
| 1960s | 11.9% |
| 1970s | 14.7% |
| 1980s | 8.7% |
| 1990s | 7.9% |
| 2000s | 6.8% |
| 2010s | 3.2% |
| 2020+ | 0.2% |
| Year | Houses | All units |
|---|---|---|
| 2014 | 35 | 47 |
| 2015 | 45 | 147 |
| 2016 | 37 | 53 |
| 2017 | 40 | 40 |
| 2018 | 35 | 64 |
| 2019 | 46 | 46 |
| 2020 | 37 | 39 |
| 2021 | 38 | 62 |
| 2022 | 40 | 40 |
| 2023 | 40 | 40 |
| 2024 | 40 | 40 |
| 2025 | 34 | 38 |
Quick answers
How many hail reports has Reno County had?
NOAA logged 142 hail reports in Reno County, Kansas, from 2014 to June 2026.
How many days had hail of 1 inch or larger in Reno County?
44 days, including 21 days with hail of 1.75 inches or larger. The National Weather Service calls hail of 1 inch or larger severe.
What was the largest hail reported in Reno County?
2.75 inches (a baseball), reported on July 13, 2015.
Which month has the most hail in Reno County?
May has the most reports, 36% of the 142 in the record.
Does a hail day in the record mean my roof was damaged?
A counted day only means a spotter reported hail somewhere in the area. An inspection is the only way to know whether a roof was hit.
Next steps for Reno County
Reno County cities we cover
Next to Reno County in the Kansas ranking
- Sedgwick County (382 reports)
- Shawnee County (143 reports)
- Saline County (133 reports)
- Riley County (95 reports)
Cite this page
Data version: NOAA Storm Events hail data, 2014 to June 2026, loaded October 6, 2026. All dataset versions. Download the table as CSV. Free to quote with credit under CC BY 4.0.
Source: NOAA Storm Events Database, public domain. Counts and tables on this page are free to reuse with credit to PickARoofer under CC BY 4.0.