Winnebago County, Illinois: hail history 2014–2026
Winnebago County ranks #5 of 46 Illinois counties for hail: 159.9 reports per 1,000 square miles, 83 reports in all. Hail reached 1 inch on 31 days and 1.75 inches on 10. Record: 3 inches (a teacup), April 7, 2020 near Winnebago.
- 83reports
- 31days, 1 in+
- 10days, 1.75 in+
- 3 inlargest stone
Hail since my roof went on: Winnebago County
Year by year
| Year | Reports | Days 1 in+ | Days 1.75 in+ | Largest |
|---|---|---|---|---|
| 2014 | 11 | 4 | 2 | 2 in |
| 2015 | 2 | 2 | 1 | 1.75 in |
| 2016 | 3 | 3 | 0 | 1.25 in |
| 2017 | 9 | 3 | 3 | 2 in |
| 2018 | 3 | 1 | 1 | 3 in |
| 2019 | 1 | 0 | 0 | 0.88 in |
| 2020 | 20 | 4 | 1 | 3 in |
| 2022 | 3 | 2 | 0 | 1.5 in |
| 2023 | 11 | 4 | 1 | 2 in |
| 2024 | 2 | 2 | 0 | 1.5 in |
| 2025 | 8 | 2 | 0 | 1.5 in |
| 2026 (Jan–Jun) | 10 | 4 | 1 | 2.25 in |
2020 was the busiest year (20 reports) and 2021 the quietest (0). Winnebago County averaged 7 reports a year from 2020 to 2025, 52% above the 5 of 2014 to 2019. 2026 stands at 10 through June, already past the full-year average of 6. Days with 1-inch stones average 2.2 per full year.
Winnebago County: reports by month
| Jan | 0 |
|---|---|
| Feb | 2 |
| Mar | 2 |
| Apr | 38 |
| May | 18 |
| Jun | 6 |
| Jul | 10 |
| Aug | 4 |
| Sep | 0 |
| Oct | 0 |
| Nov | 3 |
| Dec | 0 |
April dominates the calendar: 38 of 83 reports, 46%. April to June alone bring 75%. 7 of 83 reports fell outside April to September.
Largest stone: 3 inches
Reported hail locations, Winnebago County
- 551 to 1.74 in
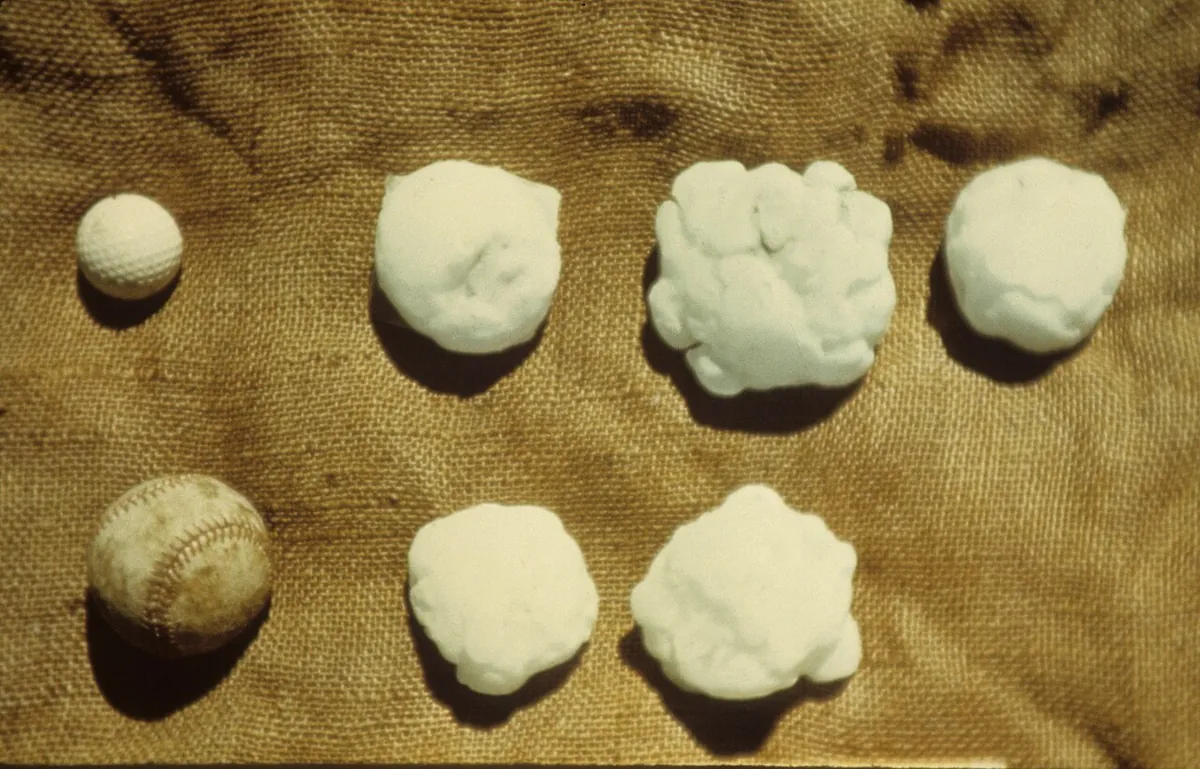
- 201.75 to 2.74 in, golf ball to tennis ball
- 22.75 in and up, baseball
Largest plotted stone: 3 in. Bigger dots are bigger stones.
77 reports of 1 inch or larger have coordinates. Each dot is a reported location, not a storm path.
Sources: NOAA, Census county outlineWinnebago County’s ten biggest hail days
| Date | Size | Reports | Place |
|---|---|---|---|
| April 7, 2020 | 3 in, a teacup | 14 | Winnebago |
| May 2, 2018 | 3 in, a teacup | 3 | Rockford |
| April 17, 2026 | 2.25 in, a hen egg | 6 | Durand |
| May 15, 2017 | 2 in, a hen egg | 4 | Samuelson Corners |
| June 29, 2023 | 2 in, a hen egg | 4 | Loves Park |
| May 12, 2014 | 2 in, a hen egg | 1 | Beloit |
| April 12, 2014 | 1.75 in, a golf ball | 4 | Rockford |
| May 17, 2017 | 1.75 in, a golf ball | 2 | West End |
| April 9, 2015 | 1.75 in, a golf ball | 1 | Cherry Vly |
| July 20, 2017 | 1.75 in, a golf ball | 1 | Winnebago |
“Hail ranging from 2.5 to 3.0 inches in diameter was reported from multiple locations in far southeast Rockford.”
NWS report, May 2, 2018
“A few hail reports came from south of Durand ranging in size from 1.25 to 2.25 inches in diameter.”
NWS report, April 17, 2026
Tornadoes and wind in Winnebago County
12 tornadoes on record in Winnebago County; the strongest listed is EF1, 10.88 miles long, near Harrison. Top gust: 96 mph near Rockton Wgn Wheel Ar.
| Date | Rating | Path length | Width | Near |
|---|---|---|---|---|
| April 17, 2026 | EF1 | 10.88 mi | 350 yd | Harrison |
| March 31, 2023 | EF1 | 8.63 mi | 300 yd | Loves Park |
| August 10, 2020 | EF1 | 6.03 mi | 300 yd | Samuelson Corners |
| March 31, 2023 | EF1 | 5.79 mi | 300 yd | Rockford |
| March 31, 2023 | EF1 | 4.53 mi | 600 yd | New Milford |
| April 17, 2026 | EF1 | 3.95 mi | 400 yd | Harrison |
| June 28, 2017 | EF1 | 0.4 mi | 200 yd | Cherry Valley |
| August 10, 2020 | EF0 | 1.58 mi | 50 yd | Rckfrd Cottonwood Ar |
| Date | Gust | Near |
|---|---|---|
| May 17, 2017 | 96 mph | Rockton Wgn Wheel Ar |
| August 10, 2020 | 85 mph | Rckfrd Cottonwood Ar |
| March 5, 2022 | 81 mph | (Rfd) Rockford Airport |
| April 30, 2022 | 81 mph | Rockford |
| July 15, 2024 | 81 mph | Woodcrest |
| July 15, 2024 | 81 mph | (Rfd) Rockford Airport |
Homes in Winnebago County
Median build year in Winnebago County: 1971. 86.8% of 124,959 homes predate 2000. Houses permitted since 2014: 2,035, or 16.3 per 1,000 homes. Busiest year: 2025.
| pre-1940 | 15.4% |
|---|---|
| 1940s | 6.4% |
| 1950s | 14.2% |
| 1960s | 12.8% |
| 1970s | 14.9% |
| 1980s | 10.7% |
| 1990s | 12.3% |
| 2000s | 10.9% |
| 2010s | 2.0% |
| 2020+ | 0.2% |
| Year | Houses | All units |
|---|---|---|
| 2014 | 123 | 139 |
| 2015 | 78 | 122 |
| 2016 | 178 | 194 |
| 2017 | 188 | 195 |
| 2018 | 164 | 220 |
| 2019 | 179 | 250 |
| 2020 | 112 | 149 |
| 2021 | 146 | 172 |
| 2022 | 160 | 189 |
| 2023 | 150 | 171 |
| 2024 | 248 | 284 |
| 2025 | 309 | 309 |
Quick answers
How many hail reports has Winnebago County had?
NOAA logged 83 hail reports in Winnebago County, Illinois, from 2014 to June 2026.
How many days had hail of 1 inch or larger in Winnebago County?
31 days, including 10 days with hail of 1.75 inches or larger. The National Weather Service calls hail of 1 inch or larger severe.
What was the largest hail reported in Winnebago County?
3 inches (a teacup), reported on April 7, 2020.
Which month has the most hail in Winnebago County?
April has the most reports, 46% of the 83 in the record.
Does a hail day in the record mean my roof was damaged?
A counted day only means a spotter reported hail somewhere in the area. An inspection is the only way to know whether a roof was hit.
Next steps for Winnebago County
Winnebago County cities we cover
Next to Winnebago County in the Illinois ranking
- Peoria County (116 reports)
- Will County (111 reports)
- Champaign County (106 reports)
- McLean County (83 reports)
Cite this page
Data version: NOAA Storm Events hail data, 2014 to June 2026, loaded October 6, 2026. All dataset versions. Download the table as CSV. Free to quote with credit under CC BY 4.0.
Source: NOAA Storm Events Database, public domain. Counts and tables on this page are free to reuse with credit to PickARoofer under CC BY 4.0.