Hail Reports in South Bend, Indiana — Last 90 Days
NOAA Storm Prediction Center logged 7 hail reports within 25 miles of South Bend across 2 storm days, most recently on August 10, 2026. Source: SPC Local Storm Reports (preliminary, may be revised).
Data as of October 24, 2026 (last successful NOAA check). The newest report in the feed is from Oct 23, 2026. The 90-day log is SPC preliminary data. The county history (2017 to June 2026) is the NOAA Storm Events archive, 2014–June 2026; it has no storms after it ends.
- 1.50 inlargest hail near the city, last 90 days (ping-pong ball size)
- 16days with hail 1 in or larger in the county, 2014–June 2026
- 61days with 58+ mph thunderstorm wind, 2014–June 2026
- #104 of 209among the cities we cover, by hail days of 1 in or more
Has hail hit my South Bend roof since it was installed?
County-level hail reports for South Bend from the NOAA archive this page uses; a county report is not proof of damage at your South Bend address.
When does hail hit South Bend?
NOAA NCEI Storm Events, county level, 2014–June 2026
If insurance covers it, what do I pay in South Bend?
Only if the claim is approved. The ACV math is a straight-line example over a 25-year life; insurers writing South Bend policies use their own schedules, so check your policy.
Request Sent!
A local contractor will reach out as soon as they review your request.
Hail near South Bend in the last 90 days
- 1.50 inLargest hail in 90 days (ping-pong-ball size)
- 2Hail days near South Bend
- 7SPC reports
- August 10, 2026Most recent event
Around South Bend, the NOAA Storm Prediction Center logged 7 hail reports within 25 miles between August 9 and August 10, 2026, spread over 2 storm days. Both days brought stones of 1″ or more, and 4 of the 7 South Bend reports with coordinates fell within 10 miles of the city center. In a typical year South Bend sees about 4 hail-producing storms.
South Bend's storm-climate context
South Bend endures one of the heaviest lake-effect snow loads of any mid-size U.S. city, averaging 64.5 inches of snowfall per year driven by Lake Michigan fetch. That volume translates directly to structural snow load stress on residential roofs, accelerated ice-dam formation at eaves, and repeated freeze-thaw cycling that splits shingle tabs and forces flashing failures. The city records about 42 thunderstorm days annually, adding warm-season hail risk on top of the winter load. Temperatures swing from a record low of -22 F in January to a record high of 109 F in July, a wide range that places extreme thermal stress on roofing membranes and sealants over their service life.
South Bend, with 103,453 residents, is anchored by Beacon Health System (7,088 employees) and the University of Notre Dame (6,086 employees), providing a stable employment base that supports ongoing residential investment. The city's older housing stock, much of it pre-1970, means a large share of roofs are at or past replacement age. Lake-effect snow damage drives above-average insurance claims each winter, generating steady repair and replacement demand for contractors serving the South Bend metro.
How close the hail came
On August 10, 2026, a report fell just 0.3 miles from the South Bend city center, the nearest of 7 (1.00″ at 1 E South Bend). August 10, 2026 was the heaviest day around South Bend, with 6 reports and a top stone of 1.50″. Near South Bend, 2 of 2 hail days reached 1″ or larger.
| Distance from city center | Reports | Largest |
|---|---|---|
| Within 5 miles | 4 | 1.25″ |
| Within 10 miles | 4 | 1.25″ |
| Within 25 miles | 7 | 1.50″ |
Distances are straight-line from the city center to each SPC report point; reports without coordinates are left out of the table.
Hail events near South Bend by date
August 10, 2026 6 reports, hail up to 1.50″ (ping-pong-ball size) Largest in 90 days
| Time (UTC) | Hail size | Location | Distance from South Bend |
|---|---|---|---|
| 0653 | 1.50″ | Buchanan, Berrien County | 11.8 mi |
| 1055 | 1.25″ | 3 NW South Bend, St. Joseph County | 2.7 mi |
| 1045 | 1.00″ | Buchanan, Berrien County | 11.8 mi |
| 1050 | 1.00″ | 2 NW South Bend, St. Joseph County | 2.7 mi |
| 1057 | 1.00″ | 2 S South Bend, St. Joseph County | 2.4 mi |
| 1100 | 1.00″ | 1 E South Bend, St. Joseph County | 0.3 mi |
August 9, 2026 1 report, hail up to 1.00″ (quarter size)
| Time (UTC) | Hail size | Location | Distance from South Bend |
|---|---|---|---|
| 2116 | 1.00″ | Walkerton, St. Joseph County | 19.5 mi |
The South Bend tables above list preliminary Local Storm Reports from the NOAA Storm Prediction Center. Sizes are reported hailstone diameters; times are UTC. Reports can be added or corrected for about a day after each event. A quiet log does not mean no hail: small or unreported events happen. The closest report in this window landed 0.3 miles from South Bend's center.
View the 7 South Bend-area reports on a map
On the South Bend map, circle positions are the NOAA SPC report coordinates; tap a circle for the date and hail size.
Hail size: < 1″ 1–1.75″ ≥ 2″ not recorded
How severe was it? The NWS yardstick, applied to South Bend's reports
The National Weather Service calls hail severe at 1″ (quarter size) and significant at 2″ (hen-egg size). Scoring South Bend's 7 area reports (filed in Berrien, St. Joseph Counties) against that scale: 7 of the South Bend reports met the severe 1″+ criterion — the size at which asphalt shingles start taking granule loss and bruising that shows up as leaks a season later. At these sizes, damage on a South Bend roof is rarely visible from the ground, and homeowners policies typically cover it when it is documented promptly.
Hail history in South Bend: the long picture
County-level NOAA records for the county behind South Bend, 2014–June 2026. Each figure shows its source. Storms after the archive ends are not in these numbers. Ranks count from 1, the highest.
South Bend against the 209 cities we cover
- #104of 209Days with hail 1 in or larger in South Bend: middle
- #122of 209Days with hail 1.75 in or larger (golf ball) in South Bend: middle
- #68of 209Days with 58+ mph thunderstorm wind in South Bend: middle
- #85of 209Tornadoes in South Bend: middle
- #157of 209Reported storm property damage in South Bend: bottom quarter
- #16of 209Share of homes built before 1980 in South Bend: top quarter
Hail events by year
| 2017 | 11 |
|---|---|
| 2018 | 0 |
| 2019 | 9 |
| 2020 | 0 |
| 2021 | 4 |
| 2022 | 5 |
| 2023 | 14 |
| 2024 | 1 |
Years with no record show as 0. In its busiest full year (2023) South Bend's county logged 14 events; the whole span, 2017 to 2024, holds 44.
Source: NOAA Storm Events Database, county level, 2017–2024Hail history at a glance
- 44Hail events in the county, since 2017 (NOAA)
- 2.50 inLargest hailstone on record
- Jun 25, 2024Last recorded event in the archive
Hail events in South Bend's county, since 2017: 44, or roughly 5 a year, topped by a 2.50″ stone. Set against that baseline, the 2 hail days near South Bend in the 90-day window above run above the long-term average rate. Check your own South Bend address on the hail risk lookup.
Compared to the Indiana county median of 22 hail events since 2017, South Bend's county runs 2.0× above average.
Three ways a storm reaches a roof
Hail
South Bend's county days with at least one report at that size. Largest stone: 2.50 in.
Source: NOAA Storm Events Database, 2014–June 2026Thunderstorm wind
61 South Bend's county days with 58+ mph
58 mph is the NWS severe threshold. Strongest gust on record in South Bend's county: 81 mph on Jun 30, 2014.
Source: NOAA Storm Events Database, 2014–June 2026Tornadoes
9 in South Bend's county
Strongest tornado in South Bend's county: EF1 on the Enhanced Fujita scale.
Source: NOAA Storm Events Database, 2014–June 2026Costliest storm day
Mar 30, 2025
12 reports that day (12 wind); reported property damage $265,000; county FIPS 18141, 2014–June 2026.
Source: NOAA Storm Events, 2014–June 2026Peak storm month
June
In South Bend's county, 87 of 261 hail, wind and tornado reports (33%) fell in June.
Source: NOAA Storm Events, 2014–June 2026Older homes
79.4% of South Bend homes built before 1980
About 38,000 of South Bend's 47,558 housing units (share times units, rounded). Median year built: 1955. Housing units, not roofs: many South Bend homes have been re-roofed since.
Source: Census ACS (South Bend city), 2019–2023Year-by-year table with the largest stone
| Year | Recorded hail events | Largest stone |
|---|---|---|
| 2024 | 1 | 1.00″ |
| 2023 busiest largest stone | 14 | 2.50″ |
| 2022 | 5 | 0.88″ |
| 2021 | 4 | 1.00″ |
| 2019 | 9 | 1.25″ |
| 2017 | 11 | 1.25″ |
NOAA Storm Events archive, South Bend's county. Years missing from the table have no record in the archive. * 2026 covers only January to June: NOAA's file ends there, so it is not counted as the worst year or in the yearly average.
2023 was the standout hail year in South Bend's county on both counts: the most recorded events (14) and the largest stone (2.50″).
In a market with repeat hail, impact-resistant Class 4 shingles often pay for themselves through insurer premium discounts — worth discussing with a South Bend roofer if a recent event tips you into a replacement.

St. Joseph County fact sheet for South Bend homeowners
Housing age, federal disaster declarations and your state's claim deadlines in one place. All three come from public records, county level.
How old are the roofs? Homes in St. Joseph County by decade built
| pre-1940 | 18.2% |
|---|---|
| 1940s | 8.6% |
| 1950s | 15.4% |
| 1960s | 10.1% |
| 1970s | 12.8% |
| 1980s | 9.6% |
| 1990s | 10.8% |
| 2000s | 8.6% |
| 2010s | 5.2% |
| 2020+ | 0.6% |
118,329 homes, median built in 1968. 65.1% date from before 1980 and 5.9% from 2010 on; 68.8% are owner-occupied. The most common decade is the pre-1940.
Source: U.S. Census Bureau, American Community Survey · data as of ACS 5-yearWhat to do if your roof was in the hail path
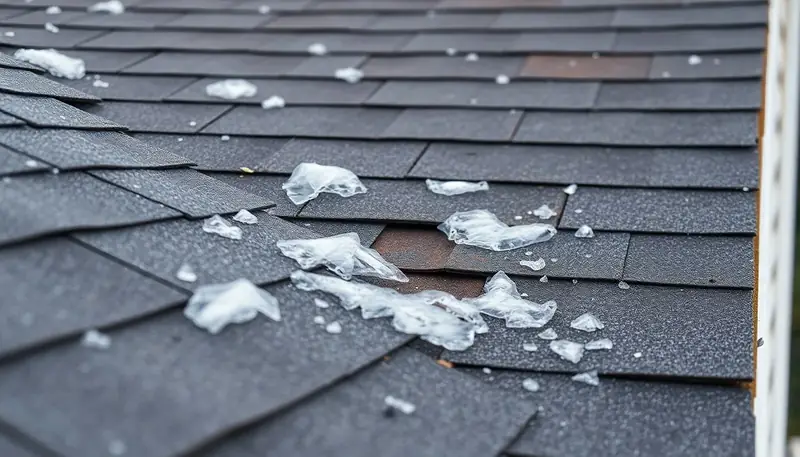
- Read the yard first; stay off the roof. Hail came as near as 0.3 miles to South Bend (1 E South Bend, August 10, 2026) in the last 90 days. Granule piles under a South Bend downspout and dents on gutters, vents and screens are the signs to look for.
- Photograph and date everything before repairs. The log's worst day near South Bend: August 10, 2026, 6 reports, largest 1.50 in. Pair that date with your dated photos and a coin-for-scale shot to pin the loss to a storm.
- Book a free inspection rather than guessing. 2 of the 2 hail days near South Bend reached 1 inch or more. Nobody on a South Bend lawn can see bruised shingles or lost granules, so a written scope from a roofer is the test for a claim.
- File on the policy's clock. The latest storm day near South Bend was 76 days ago. Your reporting window comes from the policy itself; file promptly while the dates in this log are fresh.
- Bring the written scope to the adjuster. Hand over the scope in writing: an adjuster working a South Bend claim then has the contractor's numbers. Step-by-step: the roof insurance claim guide.
Hail in South Bend — questions homeowners ask
When did hail last hit South Bend, IN?
How large was the hail near South Bend?
Does homeowners insurance cover hail damage in South Bend?
How often does hail hit the South Bend area?
How close did hail get to South Bend in the last 90 days?
Check your own ZIP in South Bend
The county figures above average over everything inside the county line. For a score tied to your South Bend address, run your ZIP through the hail risk lookup — South Bend ZIP codes include 46601, 46628, 46615, 46629, 46636.
South Bend neighborhoods — hail exposure varies by area
Hail paths track with storm cell movement, not city limits. If you're in Downtown South Bend, Notre Dame, Plymouth Heights, Hanson Park or Oak Hill, check your specific street against the report locations above — distance from South Bend's center is listed for each report.
Hail alerts for South Bend: join the list
We track NOAA hail reports for South Bend already. Email alerts are not sending yet — leave your address and you'll be on the list when they start. No spam, unsubscribe anytime.
More resources
- Roofing contractors in South Bend
- Storm damage repair in South Bend
- Roof repair in South Bend
- Roof inspection in South Bend
- Insurance claim guide
- Roof replacement costs in South Bend
- Emergency roof repair
- All recent hail reports
- Hail risk lookup
Sources: NOAA Storm Prediction Center Local Storm Reports (last 90 days, preliminary) and the NOAA NCEI Storm Events Database (county of the city, 2014–June 2026); U.S. Census Bureau American Community Survey 5-year estimates (housing). The Storm Events archive used here ends in 2024, so storms between that date and the start of the 90-day log are not shown. How we collect data. Are you a roofer in South Bend? See how requests reach contractors.
How to cite this page
Free to quote with credit, under CC BY 4.0, no permission needed. The numbers are NOAA Storm Prediction Center preliminary reports: unverified, and not confirmed damage to any roof. This is not an official NOAA or NWS product.