Nebraska: hail history 2014–2026

Nebraska sits at #7 of 44 states we track on hail density: 96.0 reports per 1,000 square miles, 7,170 reports in 87 counties. The state's largest stone, 6 inches (a softball), fell in Loup County on May 29, 2022. Top three: Lincoln County (336), Cherry County (289), Custer County (260). No single county dominates.

Year by year

Hail reports in Nebraska, by year
YearReportsLargest
2014 907 5 in
2015 727 4.25 in
2016 575 5 in
2017 591 4.25 in
2018 485 4.25 in
2019 637 3 in
2020 427 4.25 in
2021 329 4.3 in
2022 541 6 in
2023 733 4.5 in
2024 502 4.5 in
2025 438 4 in
2026 (Jan–Jun) 278 3.5 in

2014 was the busiest year (907 reports) and 2021 the quietest (329). Nebraska averaged 495 reports a year from 2020 to 2025, 24% under the 654 of 2014 to 2019. 2026 stands at 278 through June, against a full-year average of 574. NOAA puts reported hail damage at $262 million over the period.

Nebraska: reports by month

Hail reports in Nebraska by month 1 Jan 1 Feb 109 Mar 687 Apr 1359 May 2110 Jun 1365 Jul 901 Aug 499 Sep 120 Oct 10 Nov 8 Dec
Hail reports in Nebraska by month
Jan1
Feb1
Mar109
Apr687
May1359
Jun2110
Jul1365
Aug901
Sep499
Oct120
Nov10
Dec8

June is the peak at 29% of reports; July follows with 19%. May to July alone bring 67%. 249 of 7,170 reports fell outside April to September.

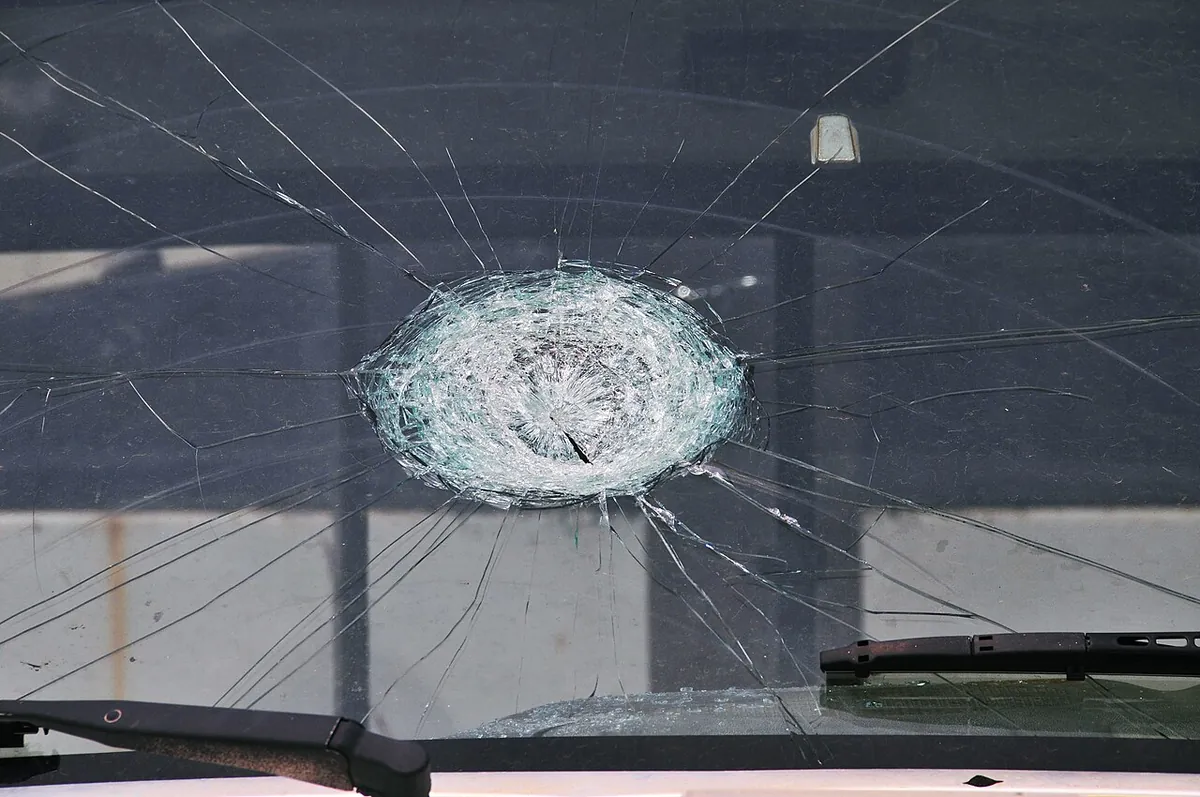
A car windshield shattered in a round spiderweb pattern where one large hailstone struck it
Example photo, not from Nebraska. Photo: FEMA.

The biggest hail days in Nebraska

DateSizeCountyReports
May 29, 20226 in, a softballLoup County7
May 9, 20165 in, a softballLancaster County9
June 17, 20145 in, a softballCherry County8
June 11, 20225 in, a softballGage County5
June 3, 20144.75 in, a softballWashington County5
July 28, 20234.5 in, a softballDodge County13
May 12, 20234.5 in, a softballPawnee County5
June 25, 20244.5 in, a softballSarpy County2

Nebraska counties, most hail reports first

CountyReportsDensityDays 1 in+Max
Douglas County198584.1443.75 in
Lancaster County186219.9545 in

85 more counties to come.

Homes in Nebraska

Median build year in Nebraska: 1975. 78.4% of 855,631 homes predate 2000. Houses permitted since 2014: 63,058, or 73.7 per 1,000 homes. Busiest year: 2021.
Share of homes in Nebraska by decade built 18.8% pre-1940 4.4% 1940s 9.2% 1950s 10.6% 1960s 15.3% 1970s 9.3% 1980s 10.8% 1990s 11.5% 2000s 9.0% 2010s 1.0% 2020+
Share of homes in Nebraska by decade built
pre-194018.8%
1940s4.4%
1950s9.2%
1960s10.6%
1970s15.3%
1980s9.3%
1990s10.8%
2000s11.5%
2010s9.0%
2020+1.0%
Nebraska: ACS, 2019 to 2023.
Building permits, Nebraska
YearHousesAll units
20144,7447,605
20155,1988,096
20165,0808,078
20175,4368,863
20184,9007,866
20194,6728,025
20205,7459,483
20216,32810,723
20225,07311,115
20234,6668,877
20245,65510,479
20255,56110,596
Nebraska: BPS, 2014 to 2025.

Next steps for Nebraska

Method · States · Hail map