Missouri: hail history 2014–2026

Missouri sits at #4 of 44 states we track on hail density: 98.8 reports per 1,000 square miles, 4,500 reports in 71 counties. The state's largest stone, 5 inches (a softball), fell in Cass County on July 17, 2023. Top three: Greene County (194), St. Louis County (193), Jackson County (152). No single county dominates.

Year by year

Hail reports in Missouri, by year
YearReportsLargest
2014 429 4.25 in
2015 365 4 in
2016 335 4 in
2017 604 4.25 in
2018 295 3 in
2019 261 2.75 in
2020 232 4.5 in
2021 143 2 in
2022 196 4 in
2023 459 5 in
2024 424 4 in
2025 449 3 in
2026 (Jan–Jun) 308 4.75 in

2017 was the busiest year (604 reports) and 2021 the quietest (143). 382 reports a year in 2014 to 2019 against 317 in 2020 to 2025: close to flat. 2026 stands at 308 through June, against a full-year average of 349. NOAA puts reported hail damage at $929 million over the period.

Missouri: reports by month

Hail reports in Missouri by month 12 Jan 128 Feb 912 Mar 1148 Apr 1326 May 313 Jun 222 Jul 147 Aug 147 Sep 68 Oct 37 Nov 40 Dec
Hail reports in Missouri by month
Jan12
Feb128
Mar912
Apr1148
May1326
Jun313
Jul222
Aug147
Sep147
Oct68
Nov37
Dec40

May is the peak at 29% of reports; April follows with 26%. March to May alone bring 75%. 1,197 of 4,500 reports fell outside April to September.

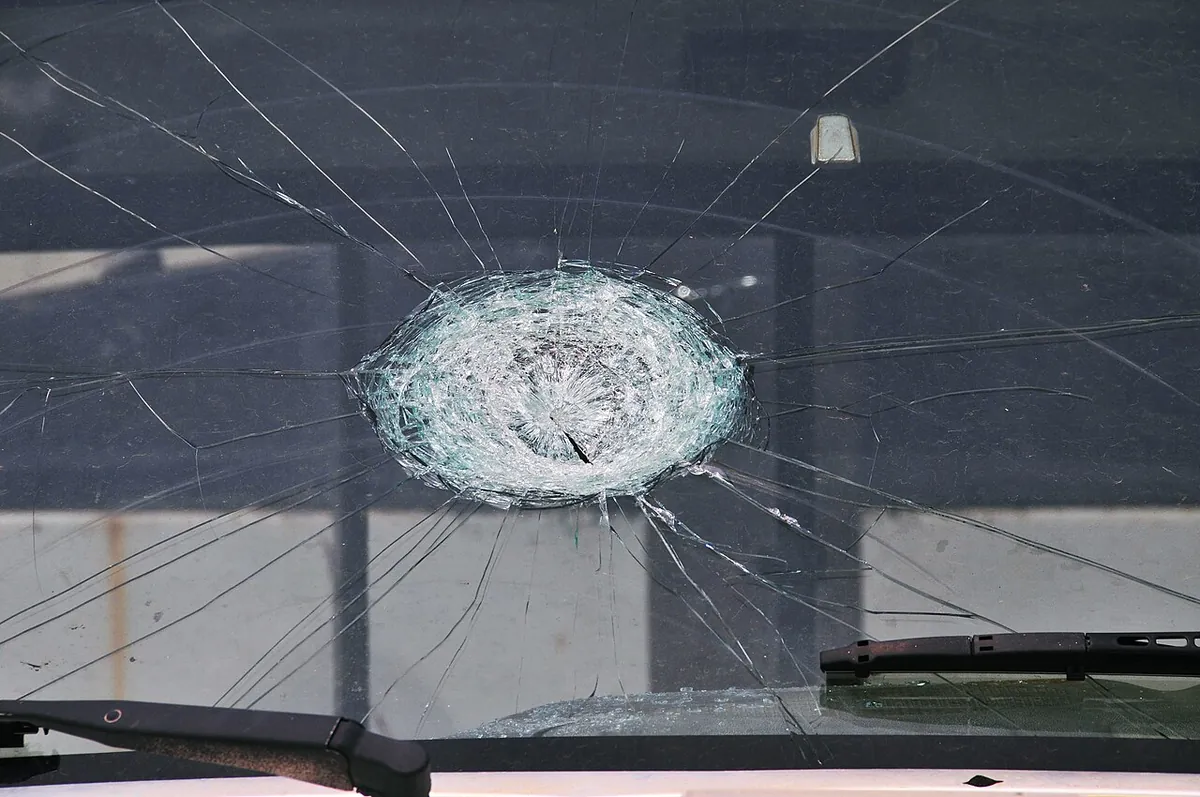
A car windshield shattered in a round spiderweb pattern where one large hailstone struck it
Example photo, not from Missouri. Photo: FEMA.

The biggest hail days in Missouri

DateSizeCountyReports
July 17, 20235 in, a softballCass County7
April 28, 20264.75 in, a softballGreene County3
March 27, 20204.5 in, a softballTexas County1
May 10, 20144.25 in, a grapefruitGrundy County10
May 27, 20174.25 in, a grapefruitBates County3
June 30, 20234.25 in, a grapefruitLafayette County3
May 8, 20244 in, a grapefruitDouglas County9
May 26, 20244 in, a grapefruitWebster County7

Missouri counties, most hail reports first

CountyReportsDensityDays 1 in+Max
Greene County194286.1504.75 in

70 more counties to come.

Homes in Missouri

Median build year in Missouri: 1978. 78.5% of 2,809,501 homes predate 2000. Houses permitted since 2014: 137,713, or 49.0 per 1,000 homes. Busiest year: 2021.
Share of homes in Missouri by decade built 13.4% pre-1940 4.4% 1940s 9.8% 1950s 11.1% 1960s 14.6% 1970s 12.0% 1980s 13.3% 1990s 13.0% 2000s 7.6% 2010s 0.9% 2020+
Share of homes in Missouri by decade built
pre-194013.4%
1940s4.4%
1950s9.8%
1960s11.1%
1970s14.6%
1980s12.0%
1990s13.3%
2000s13.0%
2010s7.6%
2020+0.9%
Missouri: ACS, 2019 to 2023.
Building permits, Missouri
YearHousesAll units
20149,07216,003
201510,33918,344
201611,29218,997
201712,10918,811
201811,37616,875
201910,95517,460
202013,10719,839
202113,94121,372
202211,59820,901
202311,02216,781
202411,52818,464
202511,37417,474
Missouri: BPS, 2014 to 2025.

Next steps for Missouri

Method · States · Hail map