Kansas: hail history 2014–2026

Kansas sits at #1 of 44 states we track on hail density: 121.1 reports per 1,000 square miles, 9,701 reports in 101 counties. The state's largest stone, 5 inches (a softball), fell in Marshall County on April 26, 2016. Top three: Sedgwick County (382), Sherman County (266), Johnson County (239). No single county dominates.

Year by year

Hail reports in Kansas, by year
YearReportsLargest
2014 970 4.25 in
2015 902 4.5 in
2016 1,025 5 in
2017 977 4.25 in
2018 800 4 in
2019 829 3 in
2020 589 4.5 in
2021 537 4 in
2022 463 4 in
2023 768 4 in
2024 756 4.5 in
2025 536 4 in
2026 (Jan–Jun) 549 4 in

2016 was the busiest year (1,025 reports) and 2022 the quietest (463). Kansas averaged 608 reports a year from 2020 to 2025, 34% under the 917 of 2014 to 2019. 2026 stands at 549 through June, against a full-year average of 763. NOAA puts reported hail damage at $28 million over the period.

Kansas: reports by month

Hail reports in Kansas by month 0 Jan 26 Feb 379 Mar 1693 Apr 3101 May 1910 Jun 797 Jul 870 Aug 584 Sep 268 Oct 56 Nov 17 Dec
Hail reports in Kansas by month
Jan0
Feb26
Mar379
Apr1693
May3101
Jun1910
Jul797
Aug870
Sep584
Oct268
Nov56
Dec17

May dominates the calendar: 3,101 of 9,701 reports, 32%. April to June alone bring 69%. 746 of 9,701 reports fell outside April to September.

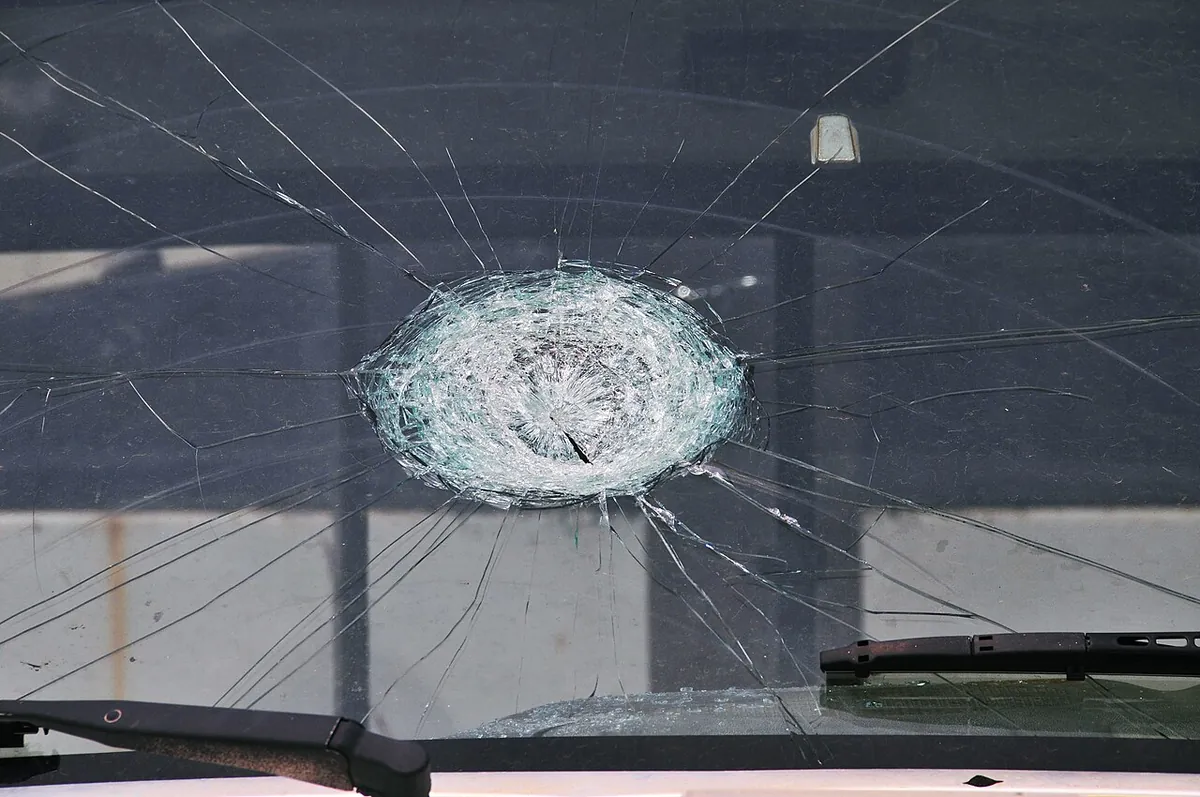
A car windshield shattered in a round spiderweb pattern where one large hailstone struck it
Example photo, not from Kansas. Photo: FEMA.

The biggest hail days in Kansas

DateSizeCountyReports
April 26, 20165 in, a softballMarshall County21
May 24, 20165 in, a softballFord County9
May 1, 20244.5 in, a softballGove County13
May 25, 20154.5 in, a softballBrown County6
July 11, 20204.5 in, a softballWabaunsee County5
June 20, 20174.25 in, a grapefruitGrant County10
July 7, 20164.25 in, a grapefruitCheyenne County5
August 10, 20174.25 in, a grapefruitTrego County5

Kansas counties, most hail reports first

CountyReportsDensityDays 1 in+Max
Sedgwick County382378.6872.75 in

100 more counties to come.

Homes in Kansas

Median build year in Kansas: 1975. 80.3% of 1,285,221 homes predate 2000. Houses permitted since 2014: 66,403, or 51.7 per 1,000 homes. Busiest year: 2021.
Share of homes in Kansas by decade built 15.5% pre-1940 5.1% 1940s 12.0% 1950s 9.8% 1960s 14.2% 1970s 11.7% 1980s 12.0% 1990s 11.3% 2000s 7.6% 2010s 0.8% 2020+
Share of homes in Kansas by decade built
pre-194015.5%
1940s5.1%
1950s12.0%
1960s9.8%
1970s14.2%
1980s11.7%
1990s12.0%
2000s11.3%
2010s7.6%
2020+0.8%
Kansas: ACS, 2019 to 2023.
Building permits, Kansas
YearHousesAll units
20144,8747,459
20155,0648,644
20165,2309,807
20176,0468,984
20185,3769,478
20195,0897,961
20205,9758,211
20216,5699,538
20225,5679,560
20234,9279,504
20245,5659,063
20256,12110,299
Kansas: BPS, 2014 to 2025.

Next steps for Kansas

Method · States · Hail map