Iowa: hail history 2014–2026

Iowa sits at #3 of 44 states we track on hail density: 101.8 reports per 1,000 square miles, 3,954 reports in 67 counties. The state's largest stone, 4 inches (a grapefruit), fell in Scott County on April 4, 2023. Top three: Polk County (195), Linn County (175), Story County (153). No single county dominates.

Year by year

Hail reports in Iowa, by year
YearReportsLargest
2014 495 4 in
2015 309 4 in
2016 167 2 in
2017 513 3 in
2018 309 3 in
2019 194 2.75 in
2020 268 4 in
2021 166 4 in
2022 215 3 in
2023 506 4 in
2024 344 3 in
2025 232 4 in
2026 (Jan–Jun) 236 3.5 in

2017 was the busiest year (513 reports) and 2021 the quietest (166). 331 reports a year in 2014 to 2019 against 288 in 2020 to 2025: close to flat. 2026 stands at 236 through June, against a full-year average of 310. NOAA puts reported hail damage at $19 million over the period.

Iowa: reports by month

Hail reports in Iowa by month 1 Jan 44 Feb 296 Mar 922 Apr 752 May 1038 Jun 370 Jul 259 Aug 197 Sep 61 Oct 12 Nov 2 Dec
Hail reports in Iowa by month
Jan1
Feb44
Mar296
Apr922
May752
Jun1038
Jul370
Aug259
Sep197
Oct61
Nov12
Dec2

June is the peak at 26% of reports; April follows with 23%. April to June alone bring 69%. 416 of 3,954 reports fell outside April to September.

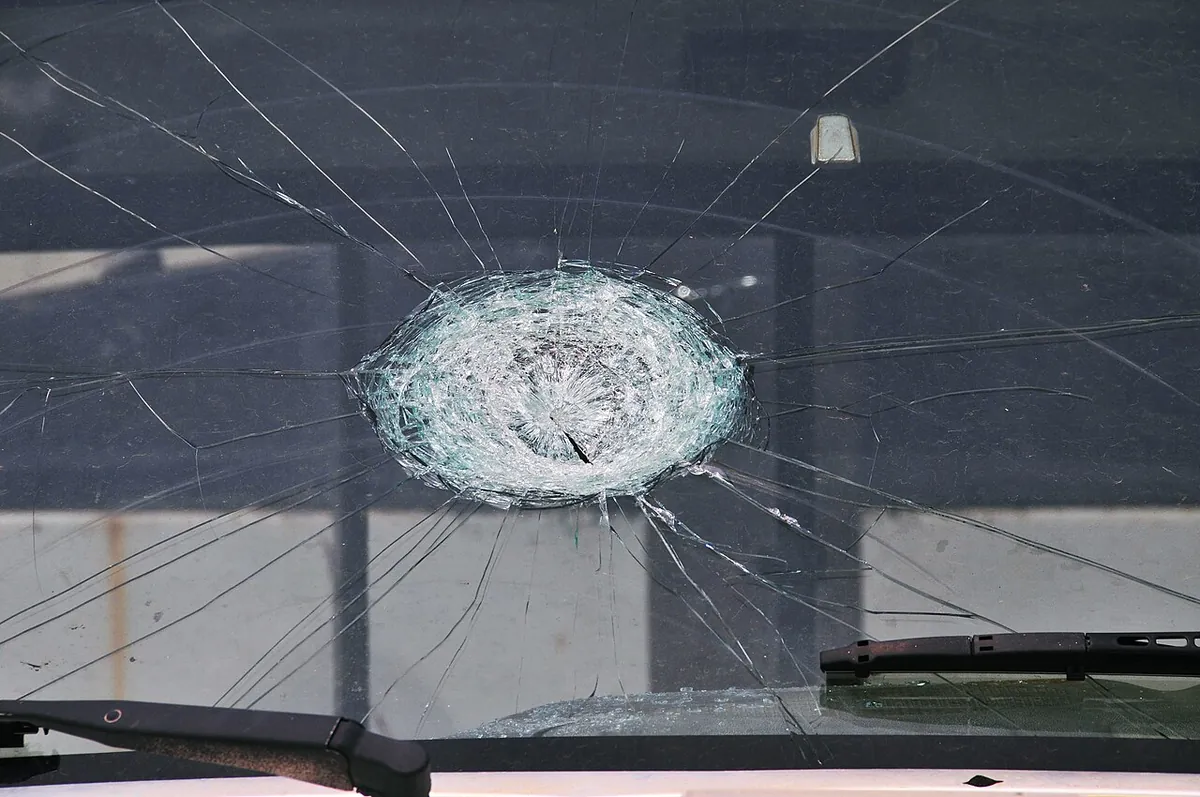
A car windshield shattered in a round spiderweb pattern where one large hailstone struck it
Example photo, not from Iowa. Photo: FEMA.

The biggest hail days in Iowa

DateSizeCountyReports
April 4, 20234 in, a grapefruitScott County34
June 30, 20144 in, a grapefruitCalhoun County9
April 17, 20254 in, a grapefruitPottawattamie County9
August 28, 20214 in, a grapefruitLyon County5
June 20, 20154 in, a grapefruitMarion County4
April 8, 20204 in, a grapefruitLee County3
June 18, 20214 in, a grapefruitAdair County2
June 24, 20153.5 in, a teacupGuthrie County44

Iowa counties, most hail reports first

CountyReportsDensityDays 1 in+Max
Linn County175241.4252.75 in
Story County153266.6272.75 in

65 more counties to come.

Homes in Iowa

Median build year in Iowa: 1971. 79.5% of 1,427,175 homes predate 2000. Houses permitted since 2014: 93,820, or 65.7 per 1,000 homes. Busiest year: 2021.
Share of homes in Iowa by decade built 24.1% pre-1940 4.7% 1940s 9.9% 1950s 9.7% 1960s 14.1% 1970s 7.1% 1980s 10.0% 1990s 10.7% 2000s 8.8% 2010s 1.0% 2020+
Share of homes in Iowa by decade built
pre-194024.1%
1940s4.7%
1950s9.9%
1960s9.7%
1970s14.1%
1980s7.1%
1990s10.0%
2000s10.7%
2010s8.8%
2020+1.0%
Iowa: ACS, 2019 to 2023.
Building permits, Iowa
YearHousesAll units
20146,98910,256
20157,42412,097
20168,20314,317
20178,06713,948
20187,31811,518
20197,87711,870
20208,63312,623
20219,15813,686
20227,62412,704
20237,42111,230
20247,78012,544
20257,32613,664
Iowa: BPS, 2014 to 2025.

Next steps for Iowa

Method · States · Hail map