NOAA hail events per year, United States, 2014 to 2024
Hail events recorded in NOAA's Storm Events Database, all states, by calendar year.
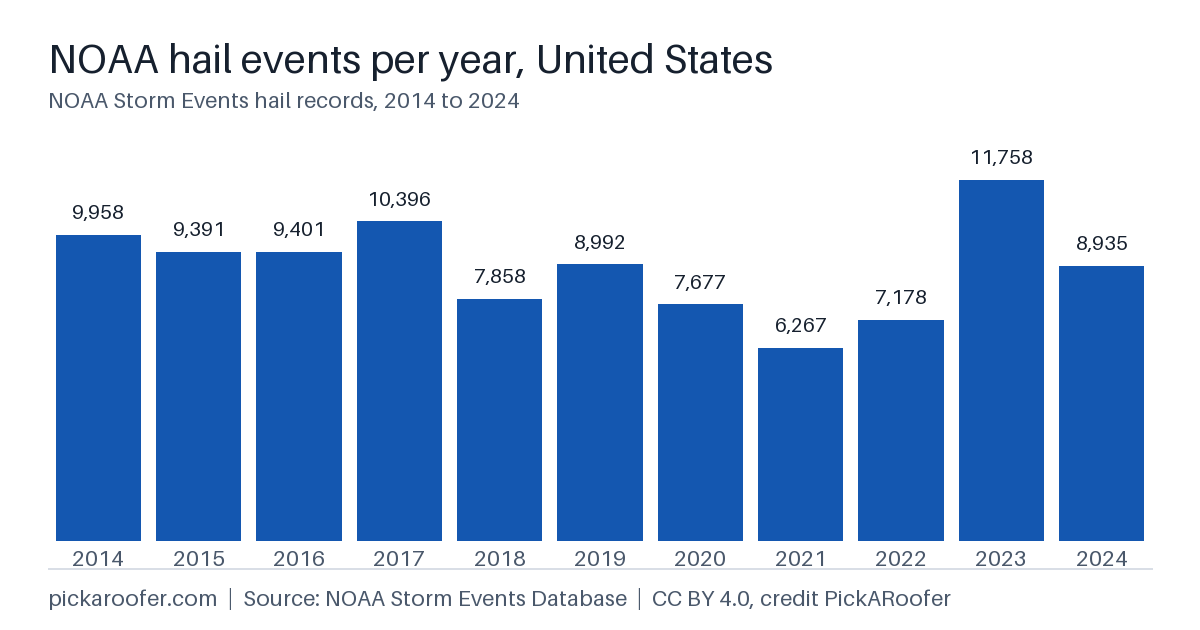
Download the PNG (1200×630). The credit is part of the image, so it travels with it.
Data behind the chart
| Year | Hail events |
|---|---|
| 2014 | 9,958 |
| 2015 | 9,391 |
| 2016 | 9,401 |
| 2017 | 10,396 |
| 2018 | 7,858 |
| 2019 | 8,992 |
| 2020 | 7,677 |
| 2021 | 6,267 |
| 2022 | 7,178 |
| 2023 | 11,758 |
| 2024 | 8,935 |
Source: NOAA Storm Events Database hail records, 2014 to 2024. A count is records, not separate storms. Not an official NOAA or NWS product. Full method and limits: State of Hail and Data & Methodology.
Use this chart
Free to use with credit under CC BY 4.0. No permission or signup needed.
The link is optional. Use the credit line if you can, or cite us as plain text. We never require a link, and we do not make a listing, a badge or a lead depend on one.
More charts
States with the most NOAA hail events · Cities with the most county hail events